Monitoring Traffic Jams, an Easy Way

| Comments

My hometown is a touristic island on the seaside near to the beach. There is only one bridge that connects it to the mainland, and it means that traffic is a nightmare during summer, with frequent and annoying jams.

jam_meme

Jam hours depend on a lot of circumstances (weekday, traffic flow dynamics, weather, etc) and they seem to be nearly unpredictable. Well, I felt that I had to do something about it. I wanted to know at least how much traffic there is now, if is increasing or not, and its typical variation within the day.

It was definitely a topic for a small passion project during work vacation, so I’ve built a small mobile app in Flask to help drivers understand whether or not put themselves on the road. I called it RomeaJam:

Screenshot

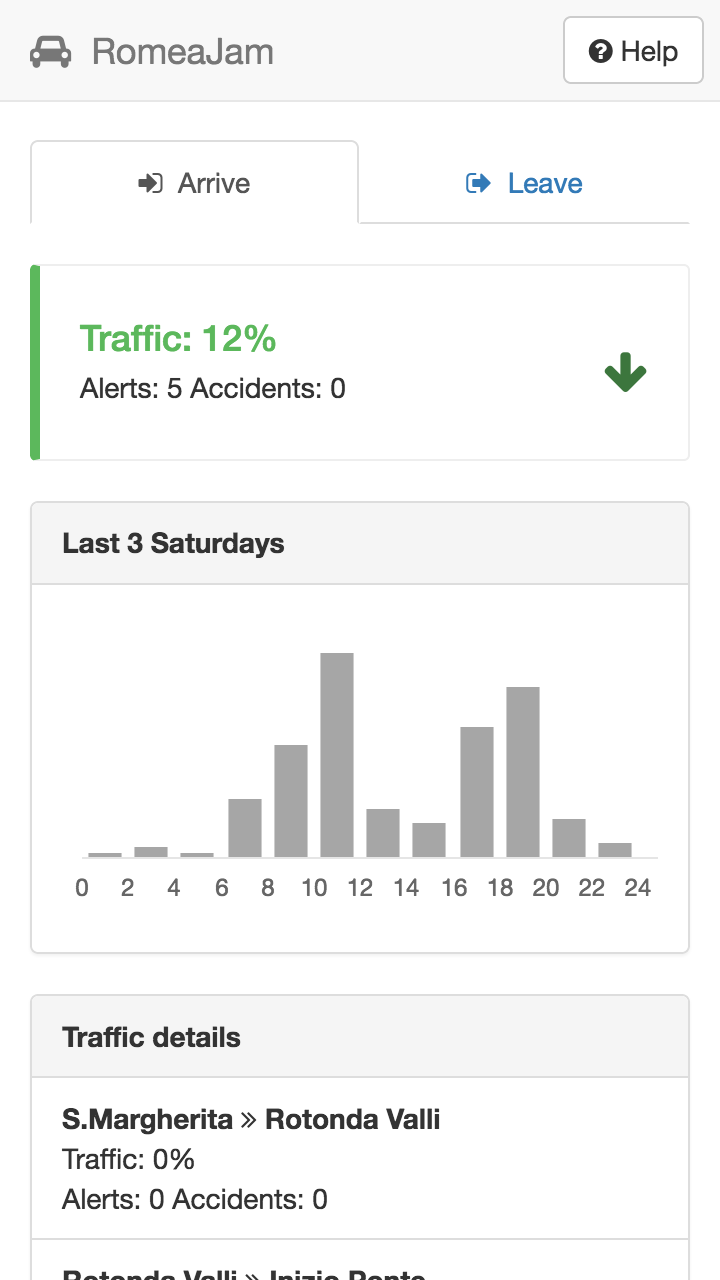
This little project led me to learn some cool Python stuff:

  • ORMs: SQLAlchemy was a revelation - I always desired an abstraction level that could handle classes without writing raw SQL!

  • Flask packages: Flask is growing very fast, and there is an ecosystem of packages for doing literally everything (scheduling jobs, manage SQLAlchemy, tracking app usage on the server side without cookies, etc)

  • Deploy Flask to production: I used apache2 with a python virtualenv, and I learned that it can be quite an hassle. I definitely have to try to dokerize it.

I’m also excited because in the next year I will have enough data for time series analysis and short term traffic predictions!

GitHub repository for this project

UPDATE (2016-11-05): The months passed and my MySQL database is still increasing (2M rows!). I learned that an index rebuild with mysqlcheck -Aa -uroot -p can speed up querying time, but still the webapp became very slow (expecially on query with joins). During the winter it’s not used, but in the next summer I will have to move old data to a different database, leaving only the last month available for the webapp.

A Recommendation Engine for Restaurants Based on Online Reviews

| Comments

As always when you are experiencing a “flow condition”, I didin’t realized that the Metis Data Science Bootcamp came to an end. During these intense weeks we deepened our knlowledge of statistics and machine learning, as well as design and data visualization, in a way that surely I wasn’t expecting at the beginning.

In the last 4 weeks we covered “Big Data” topics like Hadoop, MapReduce, Hive, etc, while focusing on a final passion project. I worked on the design and development of a collaborative-filtering recommendation engine for restaurants based on user reviews.

Scraping framework: I used Scrapy and Splash for rendering and sraping almost one million reviews of NYC restaurants. I found Scrapy a very robust and powerful tool for scraping, since it can manage concurrent requests and it can be easily integrated with javascript renderers like Splash.

Framework

The basic idea underneath the collaborative-filtering model is to look for similar users, find the restaurants that they liked and rank them.

Similar users: after feature selection (I considered only restaurants and users with at least 5 reviews) and dimensionality reduction (using the IncrementalPCA in the last version of sklearn - 0.16), I got a dense matrix in which similar users can be found with a nearest neighbors algorithm, using a correlation distance metric (it permits to take in account different scoring attitudes between users, e.g. one user may give only scores from 3 to 5 stars and another only from 2 to 4).

Sim_users

Recommendations: after getting the list of restaurants visited by the similar users, I developed a scoring method for preticting the number of stars. Based on a bayesian approach, it consists basically in updating a prior containing the overall stars smoothed by the total number of reviews for the restaurant with a posterior, i.e. the weighted average of the reviews of the similar users (where the weight takes in account the number of restaurants in common, the total reviews of the user and his number of helpful votes received).

Formula

The main tuning parameters of the model are k (the number of nearest users to consider), alpha (how many additional users to include in the prior) and beta (how many reviews a restaurant must have in order to consider the overall average stars reliable).

User interface: Afer tuning the model, I created a web application using Flask, Boostrap and other javascript packages like json2html, magicsuggest and multiselect. While I already used Flask in a previous project, Bootstrap was a very nice surpise: it’s modern, clean and easy to use - all features that makes it an ideal choice for rapid prototyping.

Here is the final version of the webapp: www.restommendation.com

Screenshot

As next steps, I will try to make the app available also for other cities, as well as creating an online-training mechanism for improving the recommendations (like/don’t like buttons).

GitHub repository for this project

Applying Clustering Techniques on Recipes and Ingredients

| Comments

In the last two weeks at the Metis Data Science Bootcamp we dived into NoSQL databases and natural language processing (week 7), unsupervised learning algorithms (week 7-8), dimensionality reduction, topic modeling and similarity (week 8), while working on an individual project: I choose to apply unsupervised learning techniques for clustering text data.

Firstly, I used the Pearson Kitchen Manager API for clustering almost 500 worldwide recipes basing on their ingredients. After applying several algorithms, I extracted the top keywords for some of the clusters and printed them in word clouds:

Rec_cluster_1 Rec_cluster_2 Rec_cluster_4

Secondly, I switched to the Yummly API for clustering ingredients on 17,000 Italian recipes from 1,000 blogs and kitchen websites. This time, the basic idea underneath ingredients clustering was to extract a bunch of not-too-rare and not-too-common ingredients, so I selected 71 ingredients with the help of a variance threshold. Then I built a relationship matrix between these ingredients using different scoring methods (jaccard similarity, joint probability score, etc). After trying some combinations of clustering algorithms and input matrices, I put one of the results in this d3 visualization:

Metis-McNulty

As we should expect, items like (yeast, flour, milk) or (mozzarella, tomato sauce, pizza doughs) are grouped together, and the clusters themselves can help while compiling a shopping list.

At the end, I learned that tuning a clustering algorithm is more an art than a science: you need to explore not conventional approaches and combine different techniques basing on your intuition and the specific question you are trying to answer.

Decision Support System for Bank Marketing Calls

| Comments

In these weeks at the Metis Data Science Bootcamp we covered SQL on cloud servers (week 4), supervised learning algorithms with sklearn and statsmodels (week 4-5), classification errors (week 5), interactive visualization and d3.js (week 6).

As a connecting fil rouge, we also worked on a individual project. I used this public dataset from the University of California containing data about bank marketing calls for a short term deposit subscription.

My initial goal was to build a classifier in order to understand the probability of subscription given a set of features about the clients (age, job, marital status, etc), the economic context (euribor rate, unemployment, etc) and the performances of the previous marketing campaigns (days from the last contact, previous campaign result, etc).
At the end, I chose a logistic regression model for its performance in terms of precision and recall.

Then, as my first d3 project, I focused on creating a day-to-day dashboard for the bank employees that could help them to address the marketing calls to the right clients in the right day.
The interface of this decision support system is quite simple: given some inputs about the current day and the economic indicators, it shows the customers sorted by their short term deposit subscription probability, with the ability to look for further details about the specific client.

Metis-McNulty

Some lessons learned during this project: feature selection and model evaluation require a deep understanding of the underlying math and the tools used, and visualization can take the same (or even more) amount of time of cleaning and preparing the data.

Github repository of this project

Update (02/24/2015): I moved the logistic regression model to Python (instead of including it in the web page with javascript) using the Flask package: live demo here. The response of the server can be a bit slower, but in this way it will be easier in the future to create a model with online training from the user inputs.

Customizing IPython Notebook

| Comments

IPhython notebook is a very popular platform for coding and sharing projects in Python. Only recently I found a lot of official and unofficial extensions for improving its usability. Among them, I installed the following:

  1. Comment-uncomment: this extension creates the shortcut alt+C for commenting code blocks (in the case you have a not-American keyboard and the standard (cmd|ctrl)-/ doesn’t work)
  2. Theme toggle: it creates a shortcut for toogle the css theme (I chose the ocean dark one).
  3. Notify: tired of checking if the kernel is still busy? This extension enables custom browser notifications for when the kernel becomes finally idle.
  4. Calico-spell-check: it creates a toolbar button for spell checking in the markdown cells.

Moreover, it’s possible to enable retina resolution on matplotlib graphs by changing the c.InlineBackend.figure_formats value in the iphyton notebook config file (usually in ~/.iphyton/profile_default/ipython_notebook_config.py), and remove the space-consuming header of the page by adding div#header {display: none !important;} to the custom.css file.

Final note: in order to work together, it’s important to load the extensions in the right oder. Here is how I load them in my custom.js file:

require(["base/js/events"], function (events) {
$([IPython.events]).on("app_initialized.NotebookApp", function () {
    IPython.load_extensions('comment-uncomment');
    IPython.load_extensions('theme_toggle');
    });
});

IPython.load_extensions('notify');
IPython.load_extensions('calico-spell-check');

require(["nbextensions/theme_toggle"], function (theme_toggle) {
    $([IPython.events]).on("notebook_loaded.Notebook", theme_toggle.theme_toggle_shortcut);
});

Project Luther: Web Scraping and Linear Regression on Box Office Movies Data

| Comments

Last two weeks at the Metis Data Science Bootcamp were quite intense. We learned the basics of web scraping with two interesting and powerful Python packages, BeautifulSoup and Selenium, how to analyze and manipulate dataframes with Pandas and theory/applications of linear regression models.
At the end, we developed and presented to the class an individual project based on “movies data”. Everyone tried to answer a different question, from predicting success of movies based on tv series to understanding the key factors that determine the success of trilogies. My project was about predicting the box office opening income during the first weekend and determing the additional opening revenues in case of changing the release season given the genre.

Predicting opening income

A couple of lessons learnt: production budget and number of opening theaters play a important role in predicting the opening income, and sometimes the holiday season doesn’t represent the “best season” in case of comedy or action films.

More insights in this presentation; web scraping scripts and linear regression analysis in this GitHub repository.

Hello World!

| Comments

First day at the Metis Data Science Bootcamp! We started with an interesting icebreaker game, the hipster classifier, and setting up the developing environment for the next weeks (GitHub, Python packages, etc). And as a consequence of this, my first blog post!

This blog is hosted by GitHub pages, using Octopress as a framework for generating static content. Basically, you have a repository in your computer cloned from GitHub, with a subdirectory where you can put all your blog post files written with the markdown markup language. Two simple commands, rake generate and rake deploy, will turn the markdown files in real HTML pages and push them into your GitHub hosting service.
Personalising template and layout is quite time consuming, but there is no need to edit css or scripts.

Github pages - Octopress